Slip-Angle Sensor for the University of Toronto Formula Racing Team
Introduction
As the only point of contact between a vehicle and the ground, tires play a vital role in producing the forces that provide acceleration, braking, and handling capabilities to a vehicle. It is, thus, important to understand the mechanisms responsible for producing these forces. One such mechanism is the tire slip-angle.
The tire slip angle represents the angular difference between where the tire is headed and where it is actually going. While the heading of the tire may be controlled through the vehicle’s steering, the vehicle may not accurately follow due to the frictional resistance produced by the contact between the road and the tire. Namely, when the steering wheel is turned, the contact patch between the tire with the road resists the turning moment due to elastic friction, and results in a lateral deflection of the tire in the contact patch region. The elastic tire acts as a spring and generates a force distribution proportional to the amount of contact patch deflection. The sum of these forces results in the cornering force. This phenomenon is illustrated through Figure 1.
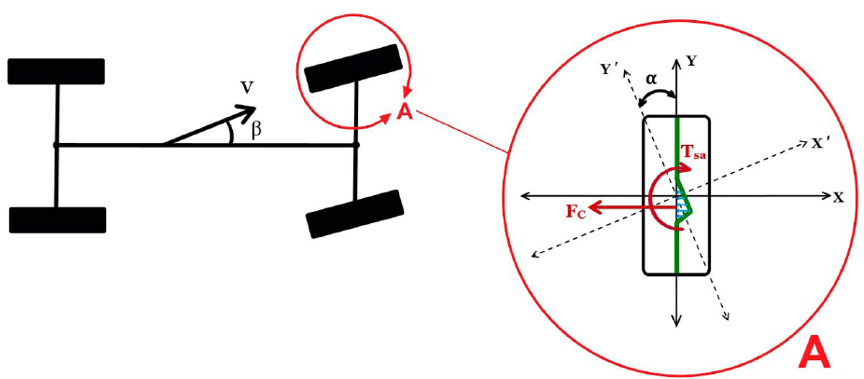
Figure 1: Tire deformation, forces, and moments.
The abovementioned cornering force is dependent on the slip angle of the tire. As shown in Figure 2, the cornering force, typically, increases to a maximum, corresponding with a peak slip angle, after which it declines rapidly. A car should seek to operate at the peak slip angle of its tires to optimize cornering performance. One may note that the dependence illustrated in Figure 2 would be affected by the physical characteristics of the tire (i.e., material, shape, etc.), tire pressure, tire temperature, and tire load.
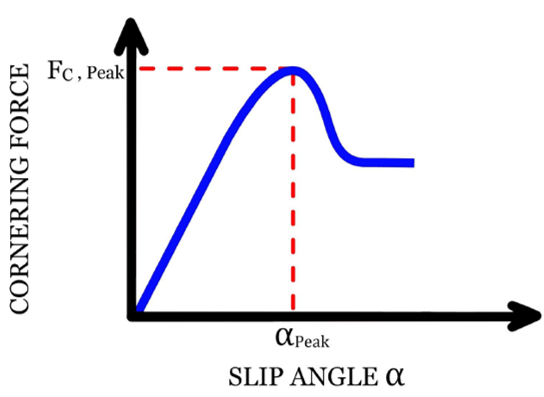
Figure 2: Cornering force versus slip-angle.
In this project, I worked in a team of four engineers on the design and development of tire slip-angle sensor. This sensor was specifically developed for the University of Toronto Formula Racing Team (UTFR), who design and build a small-scale formula racing car for competing with other university-level teams across North America. The team sought to utilize a slip angle sensor to optimize the steering and suspension system of their most recent vehicle, the UT18. The following sections provide an overview of the developed design, its details, the undertaken testing process, and conclusions.
Design Criteria
The objectives, constraints, and service environment of the design are detailed below.
Objectives
- Accuracy – defined as the error between the measured and actual slip angle, an accuracy of less than 0.5° was selected based on consultation with the UTFR team.
- Reliability –The design should maintain its accuracy over the full range of operating conditions.
- Compatibility – The design should not interfere with the vehicle dynamics, driver performance, and utilize the onboard data-acquisition unit.
- User-friendliness – The installation of the sensor should take less than 15 minutes.
Constraints
- Cost – must be less than $1000 CAD.
- Compatibility – must be compatible with the existing vehicle.
- Safety – must not compromise the safety of the drive.
Service environment
- Operating environment: varying temperature, humidity, and precipitation, and varying road surface roughness, inclination, dirt and gravel.
- Vehicle properties: varying ride height, uncontrolled pitch, yaw, and roll movements, and vehicle vibrations.
Detailed Design
An optical processing solution was adopted for measuring the tire slip angle. Through this solution, a face-down camera is attached to the vehicle, and images are continuously captured of the operating surface, Figure 3. The slip-angle can be measured by comparing the relative position of features on subsequent images. Other solutions, such as dual-antenna GPS and laser doppler velocimeter were also considered but were deemed infeasible due to operation and cost constraints.
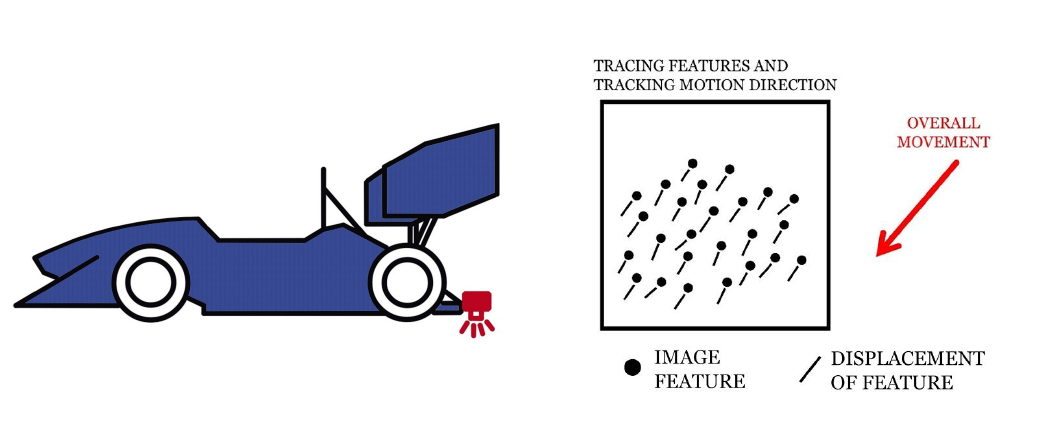
Figure 3: Optical processing solution overview.
The development of an optical processing solution requires the selection of a camera and lens, a source of illumination, electrical hardware, and necessary packing. These are further detailed below.
Camera and Lens
To successfully deliver a working prototype within the given budget and schedule, an optical mouse sensor was repurposed as the camera. Such sensor are typically integrated into a single module that also includes a processing unit and feature tracking capabilities.
However, a computer mouse cannot be directly implemented onto UT18 due to inadequate maximum working distance and speed. The working distance of a mouse, defined as the distance between the optical sensor and the working surface, ranges between 2mm - 3mm. Rigidly attaching a mouse to UT18 at this height may be detrimental as the vehicle is susceptible to uncontrolled pitch, yaw and roll movements which creates contact between the ground and the sensor. Furthermore, the sensor’s frame rate restricts the maximum working speed of the sensor (between 5 Km/h to 23 Km/h). Exceeding this speed hinders the sensor’s ability to deduce movements as the overlap area of the subsequently taken images is diminished.
To overcome these difficulties, the proposed solution places the optical mouse sensor further away from the ground and modifies the lens to focus the image at a higher height. Furthermore, it captures a larger surface area of the ground; thus enabling the mouse to be operable at higher speeds.
Illumination
Optical mouse sensors are typically strictly sensitive to wavelengths corresponding to red light. As such, two high power Red Star LEDs are chosen to illuminate the working surface. Star type high power LEDs are advantages with respect to more common ordinary LEDs as they allow for a wide range of illumination intensity control, reduce packaging size and allow for coupling with commercially available lenses used to focus the light on the desired area. Each LED is equipped with a total internal reflection (TIR) lens, allowing for the light rays to focus and illuminate the surface seen by the sensor.
One may note that due to the reduction of LED forward voltage with an increase in LED junction temperature an LED driver must be used to control the illumination intensity and regulate the current consumption of the LED.
Electrical Hardware
The block diagram of the electrical system of this design is illustrated in Figure 4 below. A central microprocessor (Raspberry Pi) is used to control the LED driver, communicate with the optical mouse sensor, and send slip angle data to the vehicle’s DAQ. In addition to the LED driver explained above and the associated PWM controlled adjustment pin, two voltage regulators are necessary for supplying power to the system.
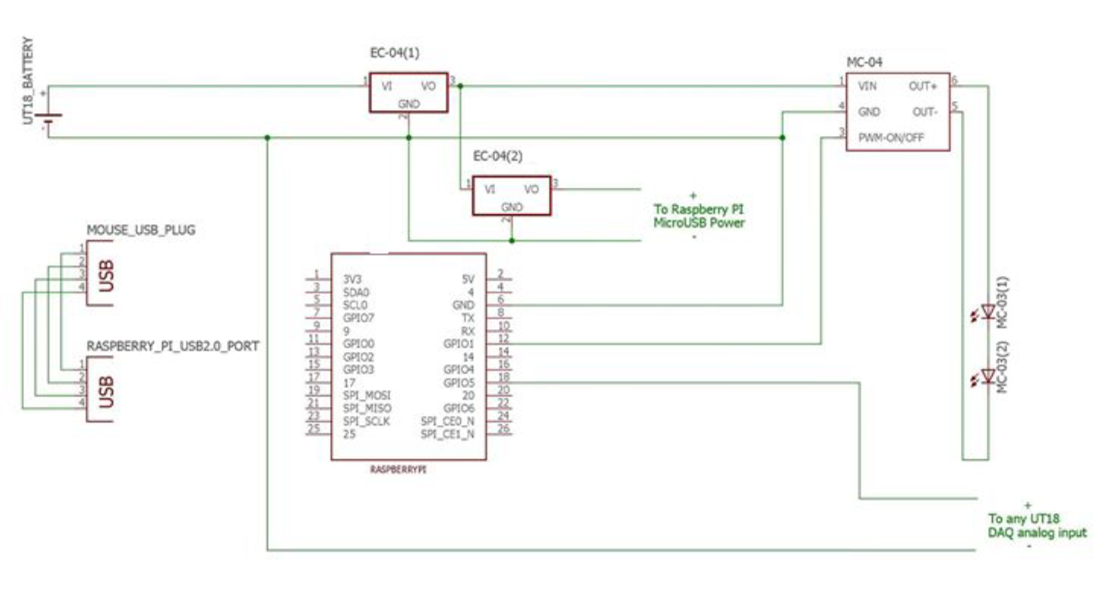
Figure 4: Circuit diagram.
Packaging
The packaging consists of the housing for the mechanical and electrical hardware, as well as the attachment to the vehicle.
Sensor Housing
The sensor housing is responsible for packaging all electrical and mechanical components, and allowing for integration into UT18. The developed sensor housing is shown in Figure 5 below. The housing is manufactured through 3D printing. It also includes air passage and heat sinks to counter the heat produced by the LEDs and the service environment.
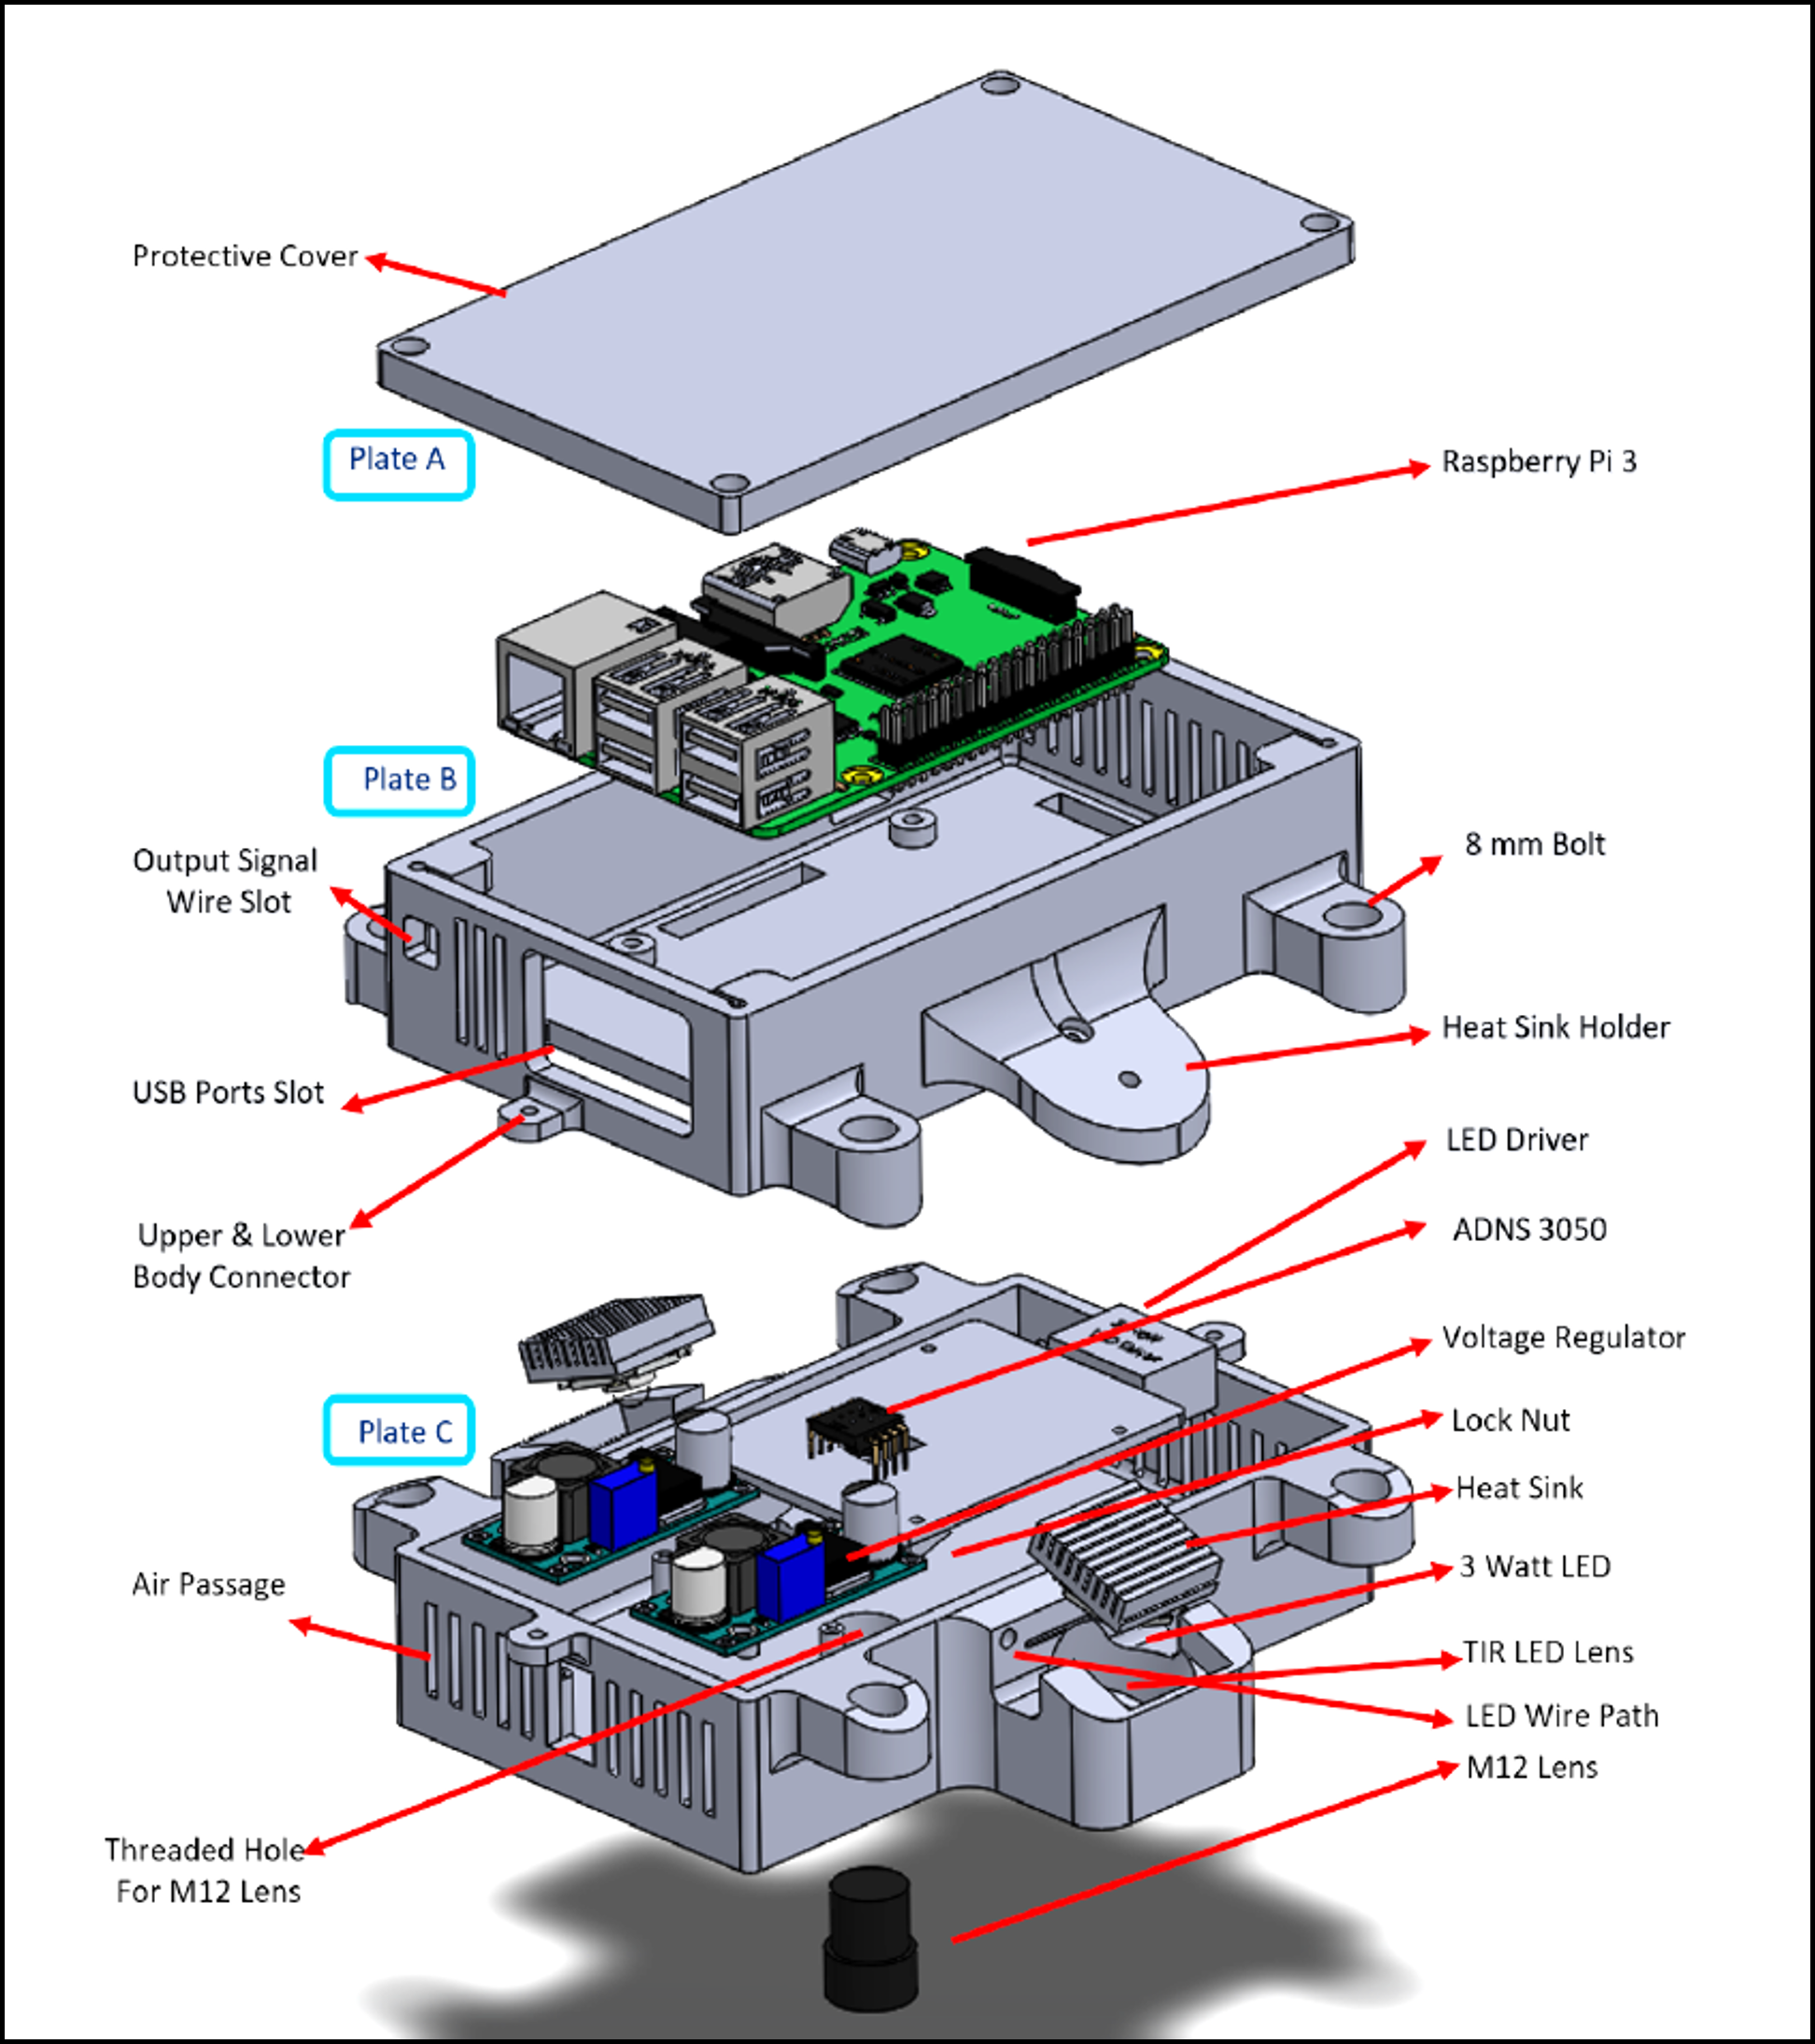
Figure 5: Sensor housing.
Integration with UT18
In order to directly obtain slip angle from the tire, the sensor assembly must be rigidly mounted to a part of the vehicle body which steers with the wheel. The optimal condition for integration of the system on the vehicle would also minimize vibrations. As such, the sensor is mounted to the non-rotating part of the spindle using an aluminum housing. This section of the vehicle is an un-sprung mass which aids in reducing vibrations to the system.
The mounting assembly and its integration with UT18 is illustrated in Figure 6. It is composed of metal tubes and laser cut sheets, assembled through welding and machine screws.
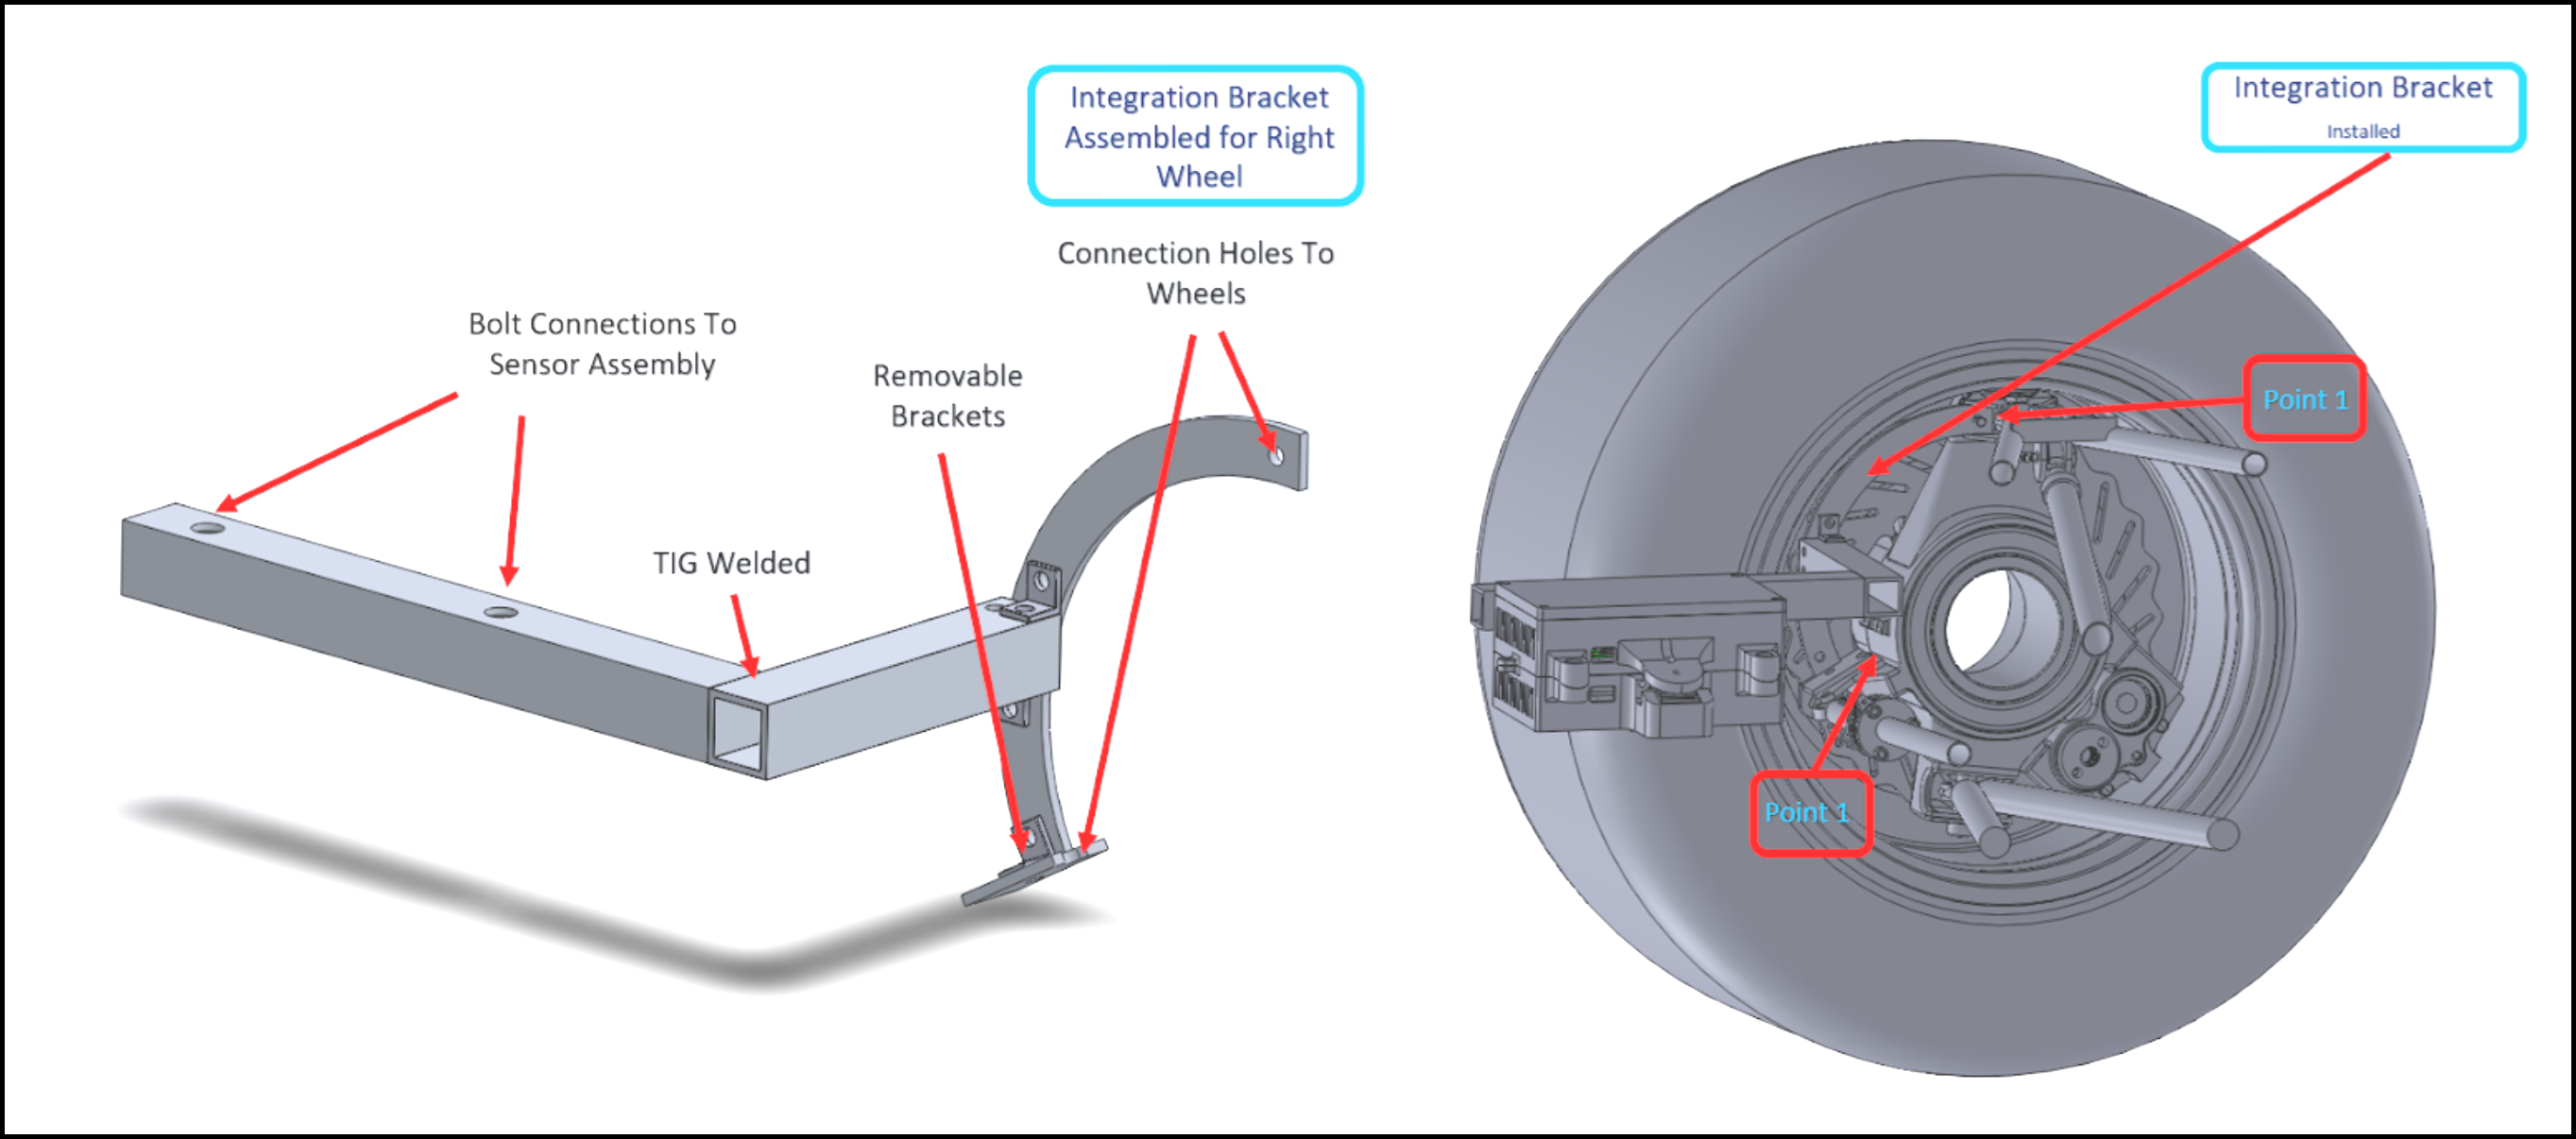
Figure 6: Integration with UT18.
Testing and Evaluation
A custom test setup was designed and manufactured to allow for testing and system characterization of the sensor with all chosen parts presented in the previous sections. As the angle accuracy of the sensor is the main objective of this design, a main test rig was specifically built to simulate a range of potential/predicted angles, and measure and compare preset angle values with those read by the sensor.
The setup consisted of a mounting bracket connected on top of a treadmill, Figure 7. The mounting bracket was designed to allow for accurate angular positioning of the sensor on top of the treadmill for verification purposes.
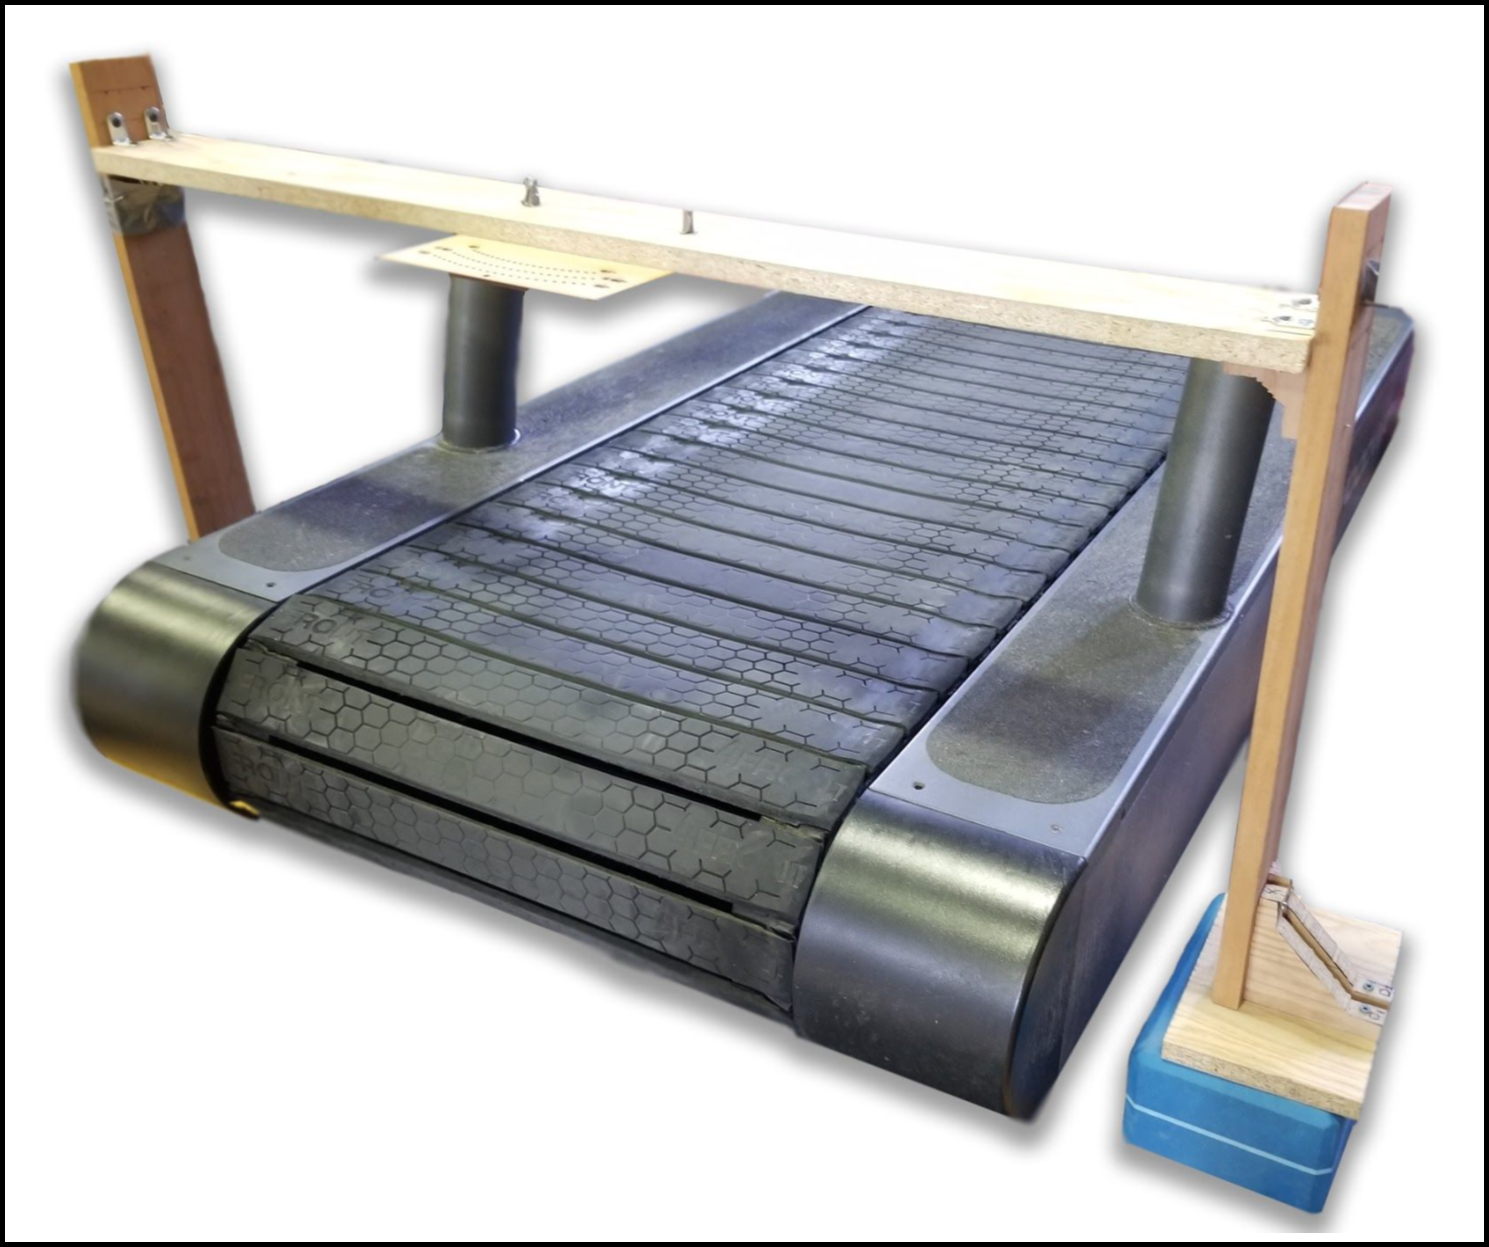
Figure 7: Test setup.
Figure 8 shows pictures of the assembled design and the test setup in practice.
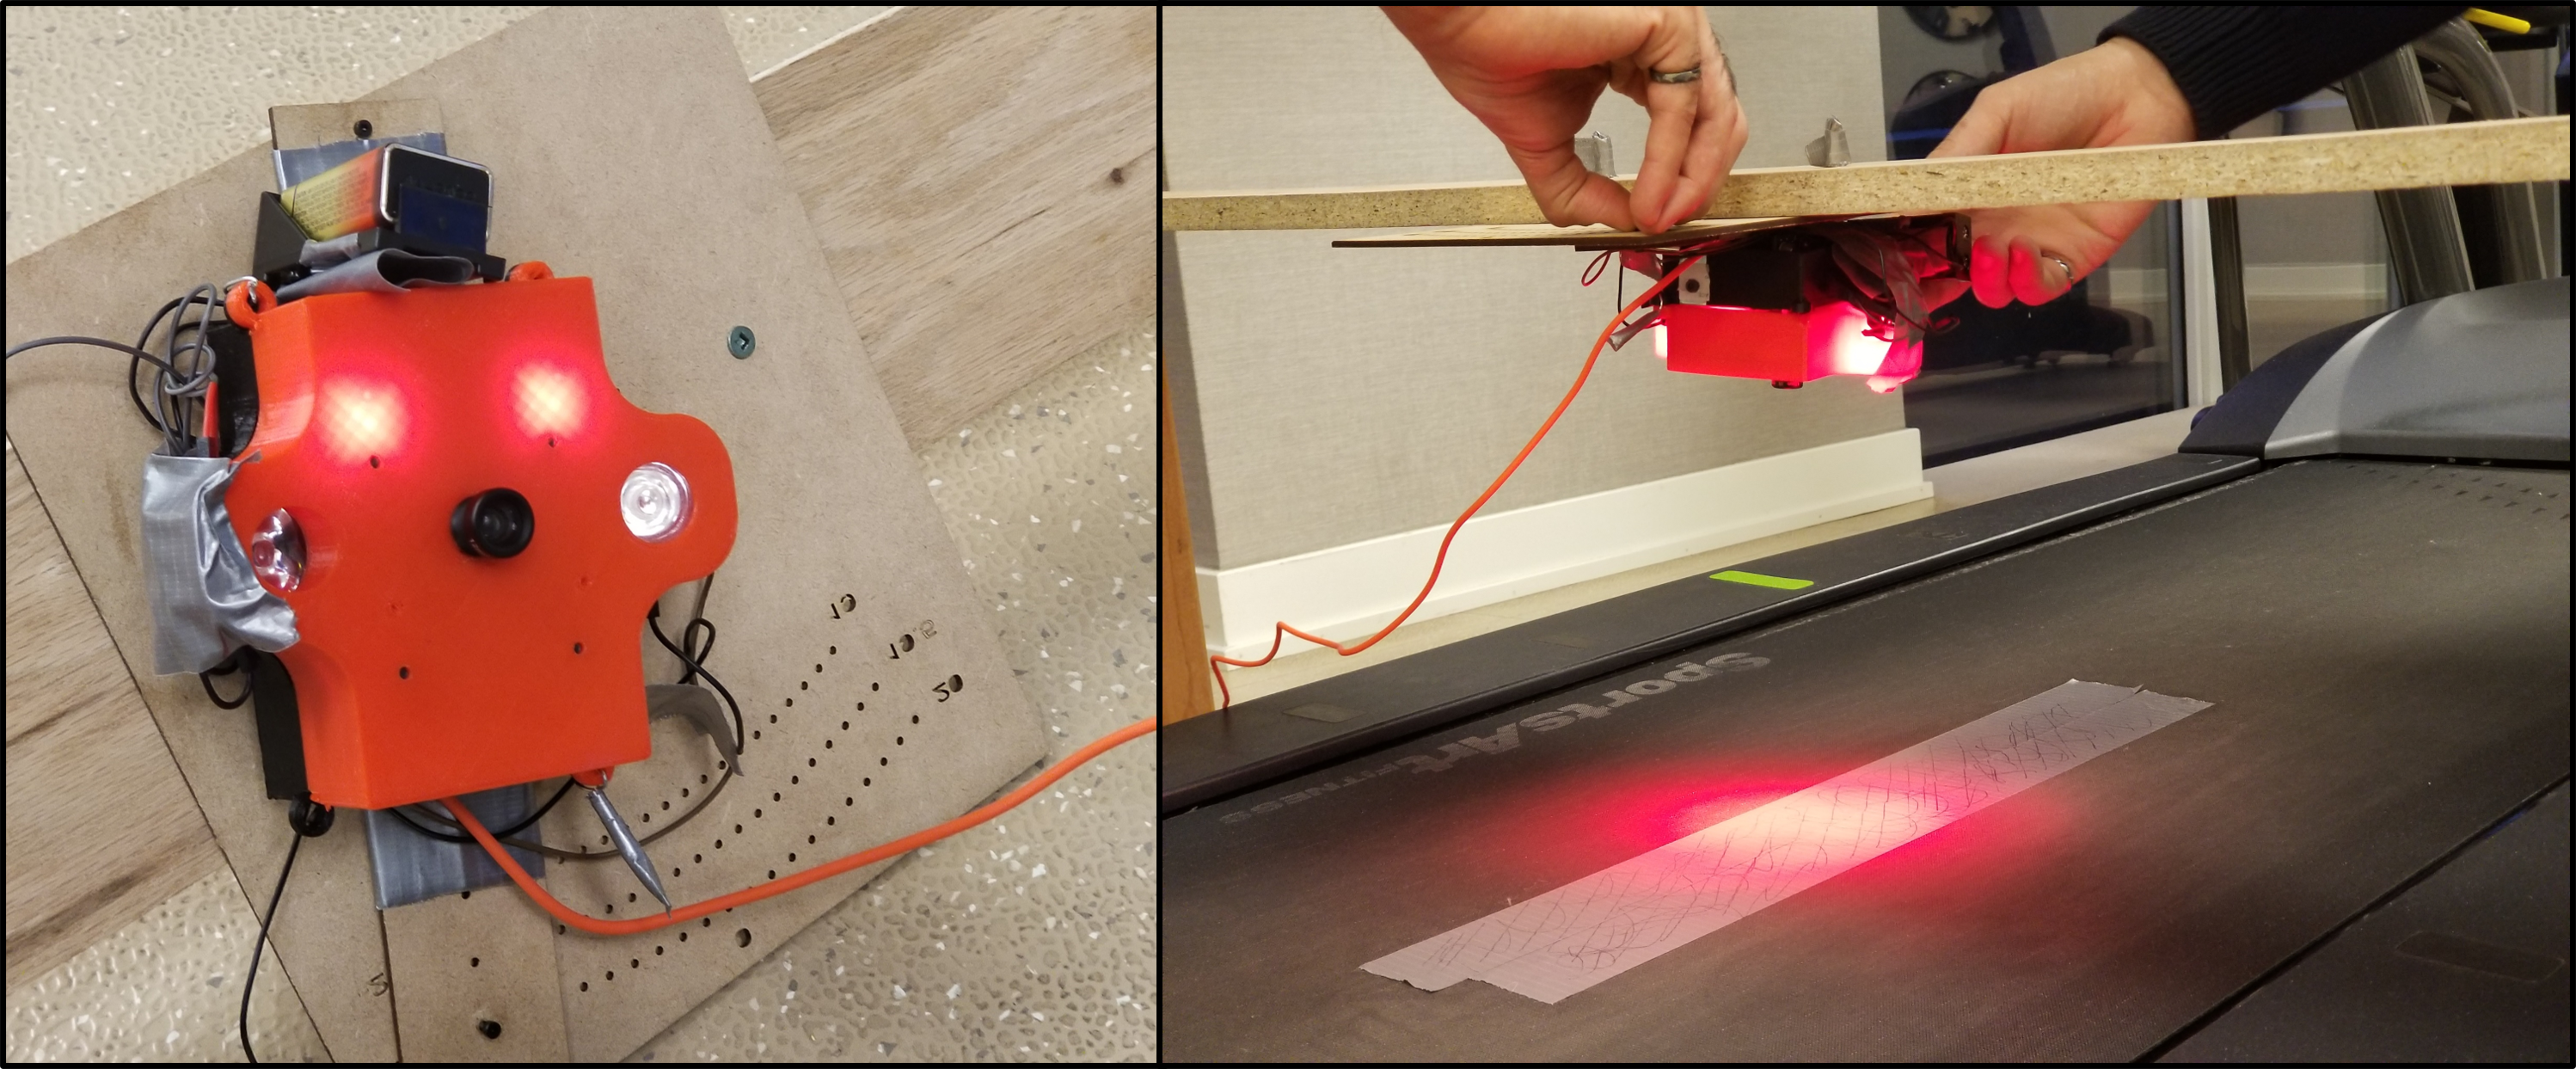
Figure 8: Assembled design and test setup.
Table 1 below details the testing results.
Table 1: Testing results.
| True slip-angle (°) | 0 | 2 | 4 | 6 | 8 | 10 | 12 | 14 | Average |
|---|---|---|---|---|---|---|---|---|---|
| Sensing error (°) | 0.78 | 0.04 | 1.53 | 0.70 | 1.85 | 2.19 | 1.14 | 0.20 | 1.05 |
Conclusions
The final design uses the principles behind existing technology which uses image processing to obtain slip angle. As the final design costs significantly less than the existing technology, it does contain more compromised specifications and restrictions on its use. Future improvements could consider adopting enhanced cameras and image processing software, and incorporating filters to improve estimation performance.