Rating Products for Amazon
Introduction
Recommendation systems are tools that filter the information available on a website to match a user’s characteristics. They can be used by companies such as Amazon, Netflix, and Twitter, to recommend users products to purchase, movies to watch, and advertisements to see, respectively. These tools typically utilize the user’s personal information, past interactions with their products, and friend groups to provide effective recommendations.
The purpose of this project was to become familiar with the recommendation system that may be used by Amazon to personalize the available products for its users. Namely, as part of a Kaggle competition for a machine learning course that I completed during my graduate studies (CSC2515), I was tasked with developing a tool that predicts Amazon product ratings based on reviewers’ information and the reviews they left for their purchased products. Machine learning was, naturally, leveraged for this task.
The following sections detail the available data, the preprocessing and exploratory analysis, model selection and tuning, and the results of this project.
The Data
The data for this project was provided by the course instructor. However, in practice, data collection may be a challenging task, where the objectives would be to ensure the dataset includes a sufficient number of points, is balanced, complete, and not noisy. User privacy must also be considered.
The provided dataset consisted of 210 thousand points. Each point, corresponding with a user-product review pair, included information about the product, information about the reviewer, and rating the reviewer left for the product. The task was, thus, to develop a model that predicts the product’s rating based on the following pieces of information:
- Product I - unique product identifier,
- Product category - product category,
- Product price,
- Reviewer ID - unique reviewer identifier,
- Review text - review left by the reviewer,
- Product summary - summary of the reviewer’s experience, and
- Review time.
Preprocessing and Exploratory Analysis
The basic statistics of the dataset are summarized in Table 1. One may note that the dataset is clearly unbalanced. However, steps to balancing were not taken as such steps would significantly reduce the size of the dataset. The effect of training on this unbalanced dataset was investigated, as will be described in the Results Section below.
Table 1: Data statistics.
| Rating (stars) | 1 | 2 | 3 | 4 | 5 |
|---|---|---|---|---|---|
| Number of points | 6366 | 6952 | 16140 | 39516 | 131026 |
Preprocessing and exploratory analyses were completed to evaluate the dependence of product category, review time, review text, and product summary on product ratings. These analyses are further detailed below.
Product Category and Review Time
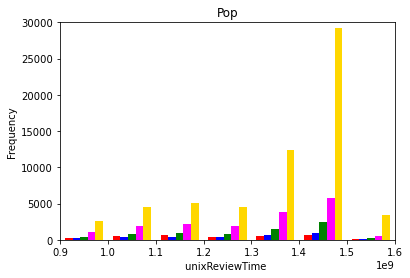
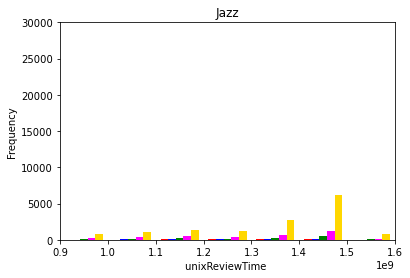
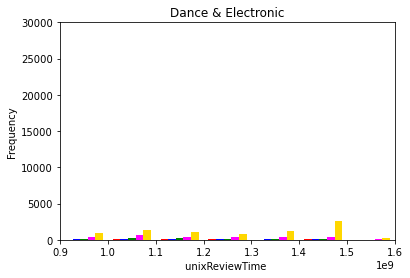
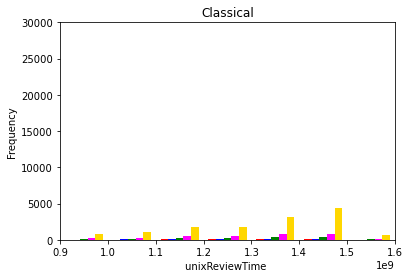
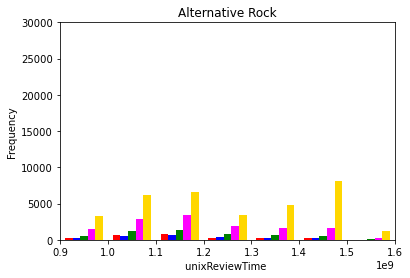
The dependence of product rating on product review time was evaluated by analyzing the histogram of overall ratings at various review times. This analysis was conducted for all product categories. Figure 1 (a)-(e) below show the pertinent histograms for the Pop, Jazz, Dance & Electronic, Classical, and Alternative Rock categories, respectively. In these figures, the red, blue, green, pink, and yellow bars correspond to one, two, three, four, and five star ratings, respectively.
(a)
(b)
(c)
(d)
(e)
Figure 1: Product ratings versus review times for the (a) pop, (b) jazz, (c) dance & electornic, (d) classical, and (e) alternative rock categories.
Two observations can be concluded from Figure 1:
- For a given category, the ratio of the number of reviews for a given overall rating changes over time. For example, in the pop category, Figure 1 (a), the number of 5-star reviews is approximately twice the number of 4-star reviews at the beginning of the time frame, but this ratio increases to approximately five times near the end. This indicates that the review time should be taken into consideration by the developed model.
- The shape of the distributions for each category is different. In the pop category, Figure 1 (a), the distribution has one peak, whereas it has two peaks in the alternative rock category, Figure 1 (e). This indicates that the given category of the album should also be taken into consideration.
Review Text and Product Summary
The review text and product summaries were preprocessed by:
- Turning all characteristics into lower case,
- Tokenizing the sentences,
- Discarding non-alphanumeric strings,
- Normalizing each string (i.e., lemmatization), and
- Removing stop words.
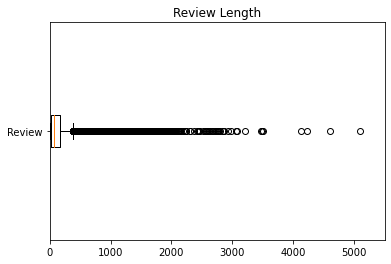
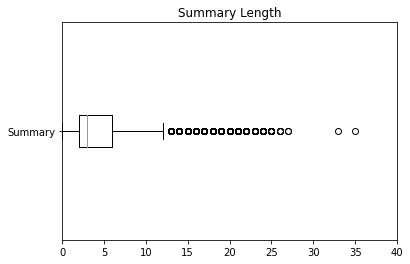
The distribution of the number of words in the review text and product summary are shown in Figure 2 (a) and (b), respectively. Reviews are at most ~5000 words, and summaries are at most ~35 words. Furthermore, the reviews are composed of 32139 unique words, and the reviews composed of 169519 unique words.
(a)
(b)
Figure 2: Number of words in (a) review text and (b) product summary.
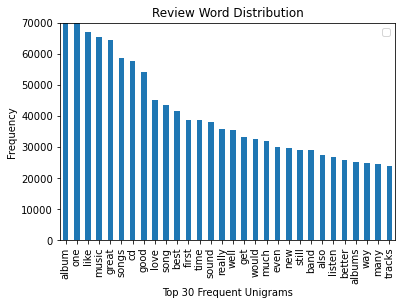
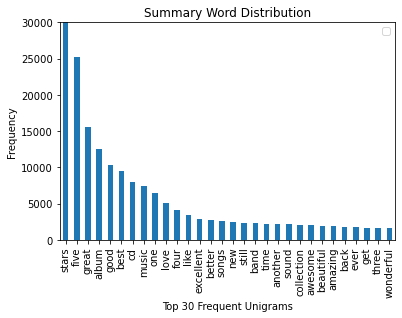
The top 30 frequent unigrams of the review and summary text are shown in Figure 3 (a) and (b), respectively. The results indicate that the top 30 unigrams generally convey a positive sentiment. These correspond to a high overall rating. As such, a large vocabulary would be required to observe words with negative sentiments. Bigrams were also considered, but discarded as they further reduced the frequency of words with negative sentiments. Based on these results, a suitable vocabulary of words was obtained.
(a)
(b)
Figure 3: Top 30 fequent unigrams in (a) review text and (b) product summary.
Model Development and Tuning
The developed model is shown in Figure 4 below. In this model, the summary and review texts are encoded as a sequence of numbers. Each number represents the index of the associated word in the devised vocabulary, and each sequence represents the corresponding sentence. The summary and review text are, then, concatenated and passed through am embedding layer. The purpose of this layer is to cast each sentence in a space that allows for sentences that have similar sentiments to be placed “closer” to each other. The embedded textual data is then passed through a LSTM layer that seeks to establish relationships between successive words. A recurrent network is suitable in such scenarios as the order of words in a sentence can affect the overall sentiment of that sentence.
The output of the LSTM layer is, then concatenated with one-hot encoded product categories and normalized review times. These are fed into two successive dense layers to estimate the product ratings.
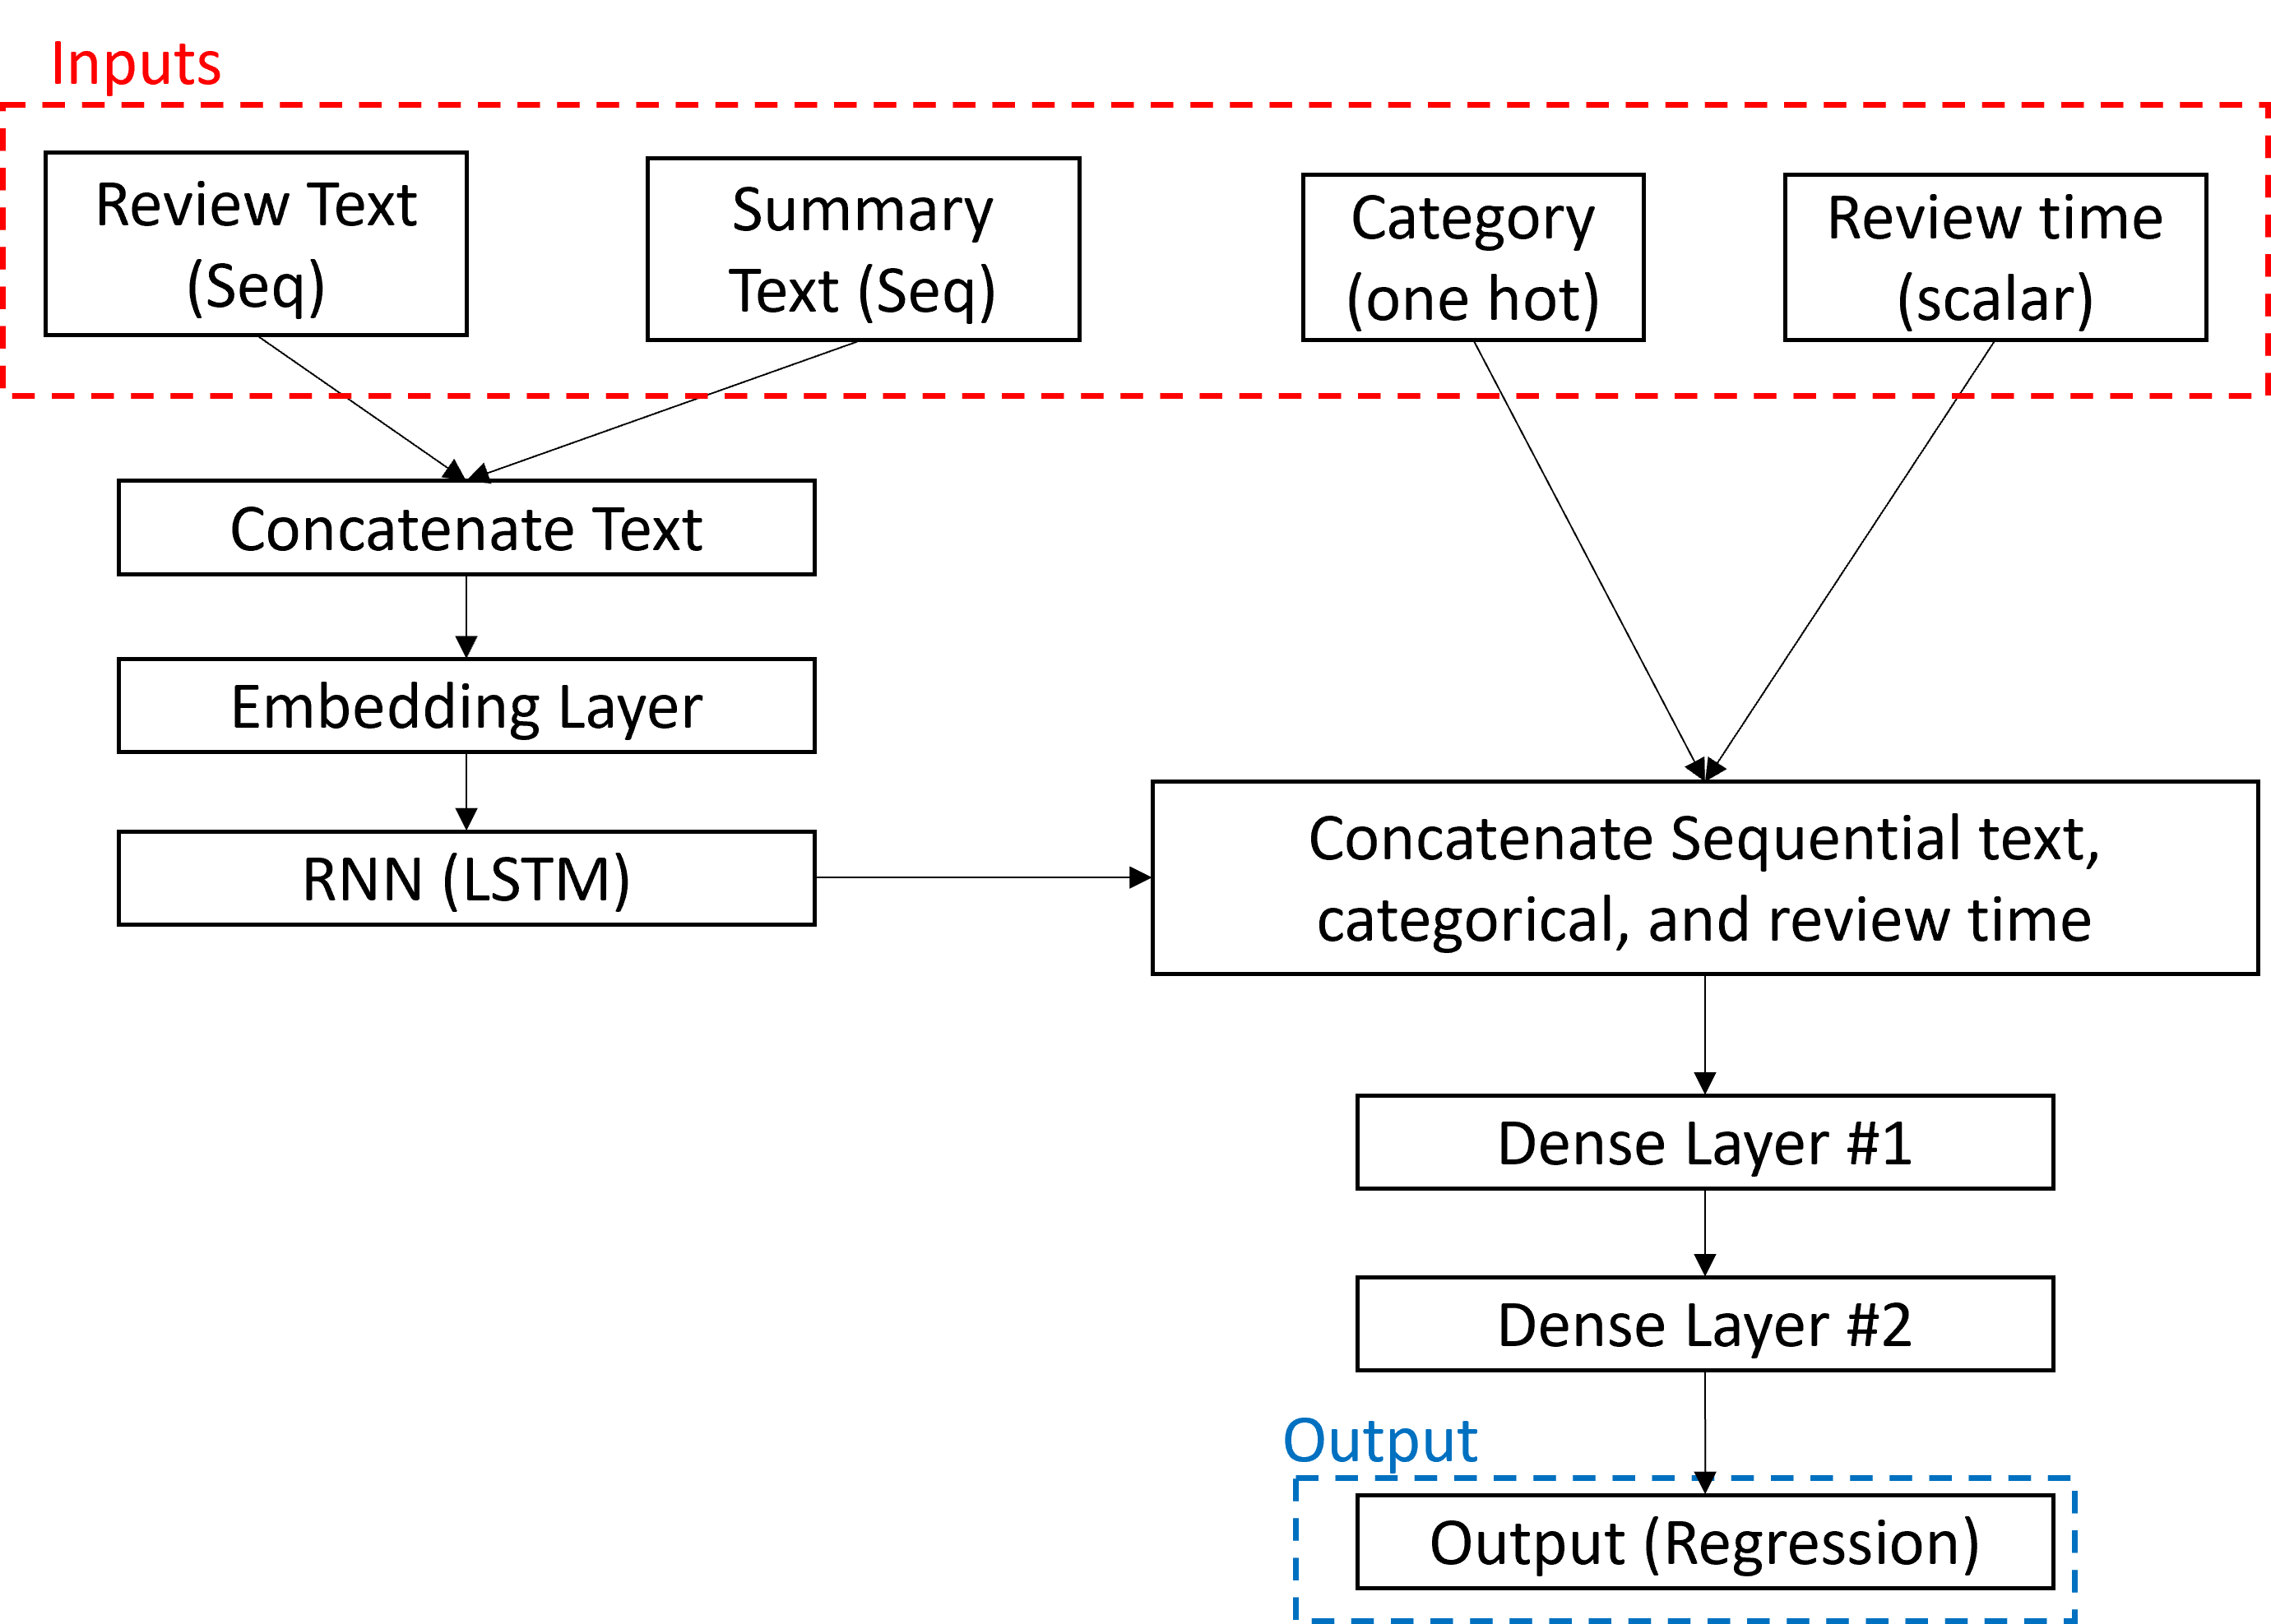
Figure 4: Product rating model.
The model was tuned with respect to three hyper-parameters: (i) the dimension of the embedding layer, (ii) the number of units in the LSTM layer, and (iii) the number of units in the first dense layer. Tuning was completed through a grid search.
Results and Conclusions
The training and validation error of the developed model is shown in Table 2 for each product rating. The error was calculated as the absolute difference between the true and predicted product ratings.
The model achieved better results for high overall ratings compared to lower ratings. This is because of the unbalanced dataset. While downs-sampling points with higher ratings and up-sampling points with lower ratings would balance the dataset, this was found to reduce the overall performance of the developed model.
Table 2: Model results.
| Rating (stars) | 1 | 2 | 3 | 4 | 5 |
|---|---|---|---|---|---|
| Training / validation error | 2.84 / 3.72 | 1.58 / 1.92 | 0.72 / 0.85 | 0.29 / 0.34 | 0.13 / 0.18 |
Future steps should consider using reviewer and product ID in the prediction framework to achieve more personalized results.